
The housing thesis
Better-capitalized housing operators can produce, preserve, and improve more housing.
The bottleneck is enterprise liquidity. A large share of the country's workforce housing is delivered by local and regional real estate businesses that can finance every building they own and not the company that owns them. Nectar capitalizes the operator. What follows is the argument for why that matters to housing supply, and what we can and cannot yet prove about it.
The argument, in five steps
01
The shortage
The country is short of housing, and short of it structurally.
The U.S. housing stock sits 3.7 million homes below long-run demand. Inadequate supply is a root cause of worsening affordability, and the gap has not closed on its own in any recent cycle.
Production is only half of it. The lower-cost housing that already exists has to be kept in the supply — which takes continued investment in homes that are already standing, not just new ones going up.
Source: Freddie Mac, Housing Supply: Still Undersupplied by Millions of Units (2024)
02
The production engine
A large share of workforce housing is delivered by operators nobody capitalizes.
Much of the country's workforce housing sits outside institutional portfolios, in smaller and midsized multifamily properties owned and run by local and regional real estate businesses.
These operators acquire, maintain, improve and preserve housing for working households. They are not a fringe of the housing delivery system; in this segment they are the delivery system.
Source: Urban Institute, Tracking Rent Payments to Mom-and-Pop Landlords (2023)
03
The missing capital layer
Real estate capital is structured around the asset, not the enterprise.
Almost all real estate financing is written against an individual property or an individual transaction. Very little of it capitalizes the business doing the acquiring and operating.
Small business lending doesn't fill the gap either — it isn't built for a balance sheet made of buildings. And institutional capital is most efficient at larger transaction sizes, with larger firms.
So the operator ends up with financing for every building and none for the company. Liquidity at the enterprise level becomes the binding constraint on how much housing that operator can handle.
Source: Urban Institute (2025); ULI, Building Small (2021)
04
The consequence
Undercapitalized operators build less, preserve less, and invest less in what they already own.
Urban Institute's interviews with small and emerging multifamily developers turn up the same constraints repeatedly: high upfront costs, limited liquidity, too little equity and too few investor relationships, and no cushion to absorb a delay or a cost overrun.
The effect isn't abstract. It shows up as projects passed on, units not acquired, repairs deferred, and months of dead time between one viable project and the next.
Source: Urban Institute research: 39 multifamily developers and 20 capital providers and public agencies interviewed; 32 housing, finance and policy stakeholders convened
Urban Institute research base
- multifamily developers interviewed
- 39
- capital providers and public agencies interviewed
- 20
- housing, finance and policy stakeholders convened
- 32
05
The model
Nectar capitalizes the housing producer, not just the housing asset.
Nectar provides flexible, cash-flow-based capital to experienced real estate businesses, underwritten against the performance of the portfolio they already operate rather than against one more building.
Operators use it to improve the housing they hold, pursue more of it, build the team required to run it, and unlock the property-level capital that was waiting on them to have a balance sheet.
How the capital reaches the housing
The bottleneck is enterprise liquidity. The consequence is housing supply and quality.
Each link is a step Nectar can observe in its own book. The last one is the step the whole thesis rests on, and it is also the one that takes longest to evidence.
01
Enterprise capital
Flexible liquidity at the business level
Hiring · working capital · predevelopment · capex
02
Operator capacity
Ability to hire, invest and absorb timing
Portfolio growth · capital access · transaction velocity
03
Housing activity
Acquisitions, development and property improvements
Acquisition · development · preservation · rehabilitation
04
Housing outcomes
Homes created, preserved and improved
Units · property quality · affordability profile
What a liquidity constraint costs
When an operator can't move, the housing doesn't happen.
Nectar can measure this directly across its own operator pipeline, without extrapolating to a national figure.
- Deals
- Projects delayed, passed on or lostCount and dollar value
- Units
- Homes not acquired, created or preservedUnits affected
- Capex
- Repairs and rehabilitation deferredDollars and units
- Time
- Months between viable projectsTime to next project
How much additional housing activity occurs when enterprise liquidity is no longer the constraint?
What has been deployed so far
The thesis is a claim. This is the book behind it.
- Capital deployed
- $50M+
- housing units financed
- 9,000+
- Transactions
- 150+
- States
- 29
Across every vehicle Nectar deploys through since 2021 — Fund II is one of them. These are firm-level figures, not Fund II figures — the Fund is one vehicle among several, and its own portfolio is reported separately once you're signed in. “Financed” describes what the capital was secured against; units created, acquired, preserved and improved are counted separately as that reporting is built out.
Track record
45 full-cycle deals
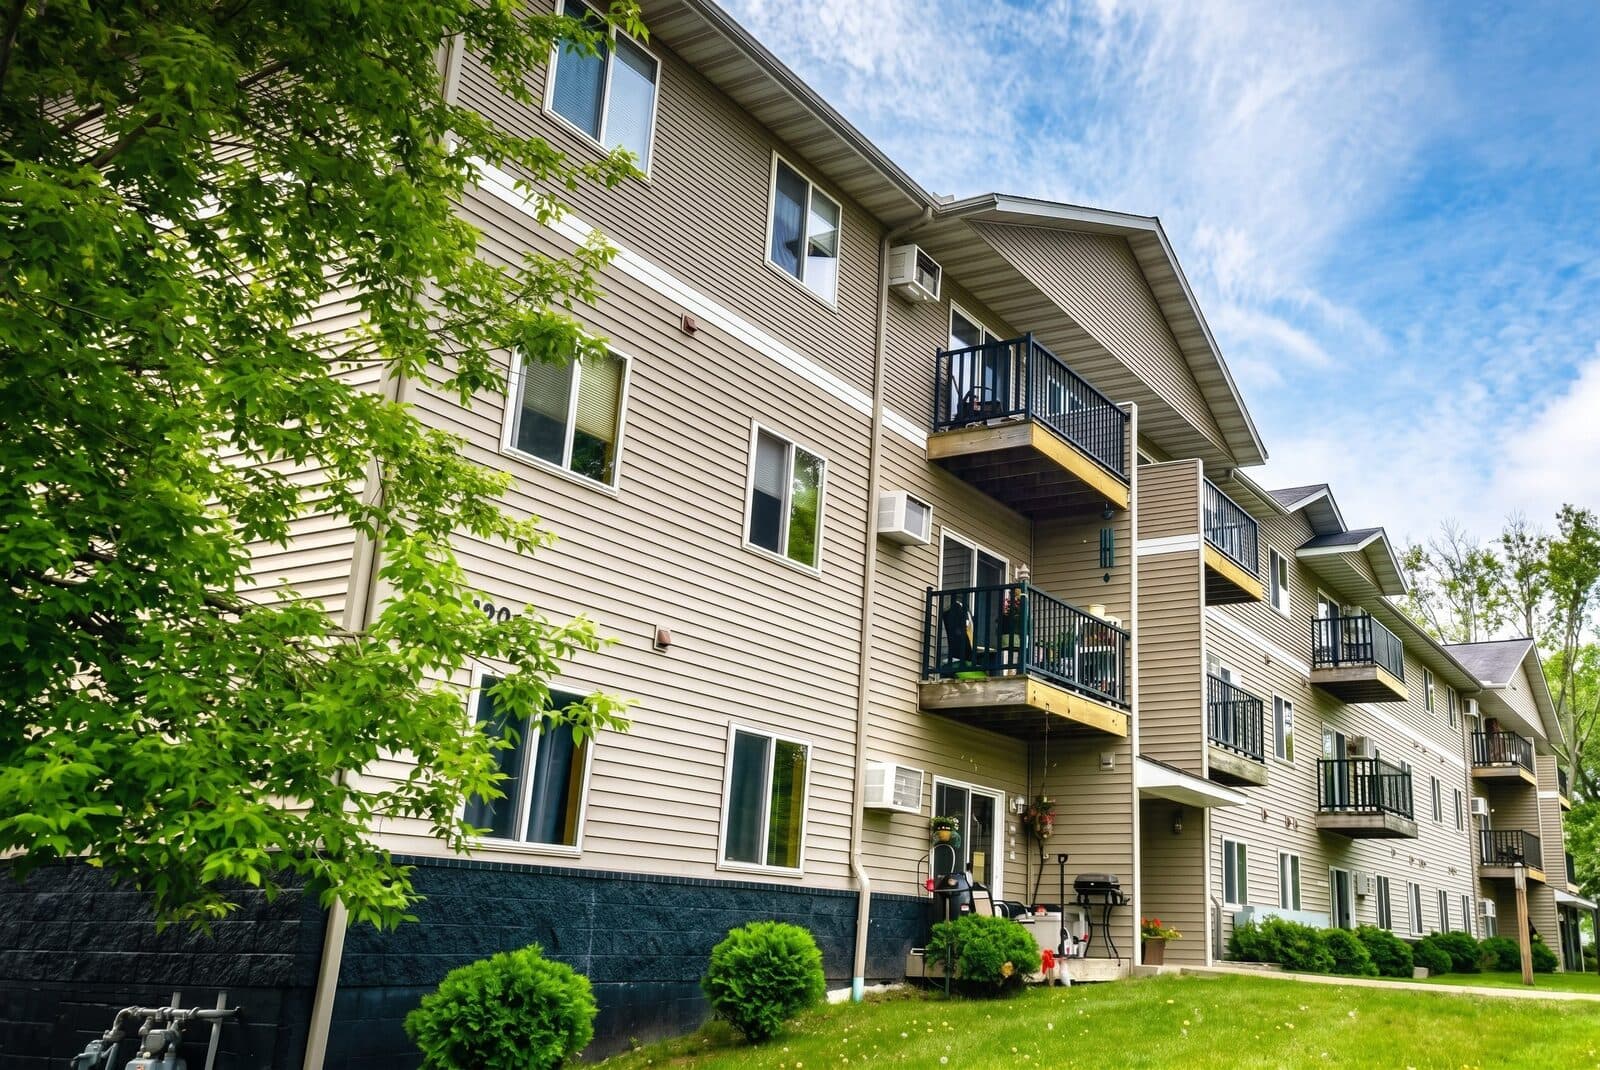
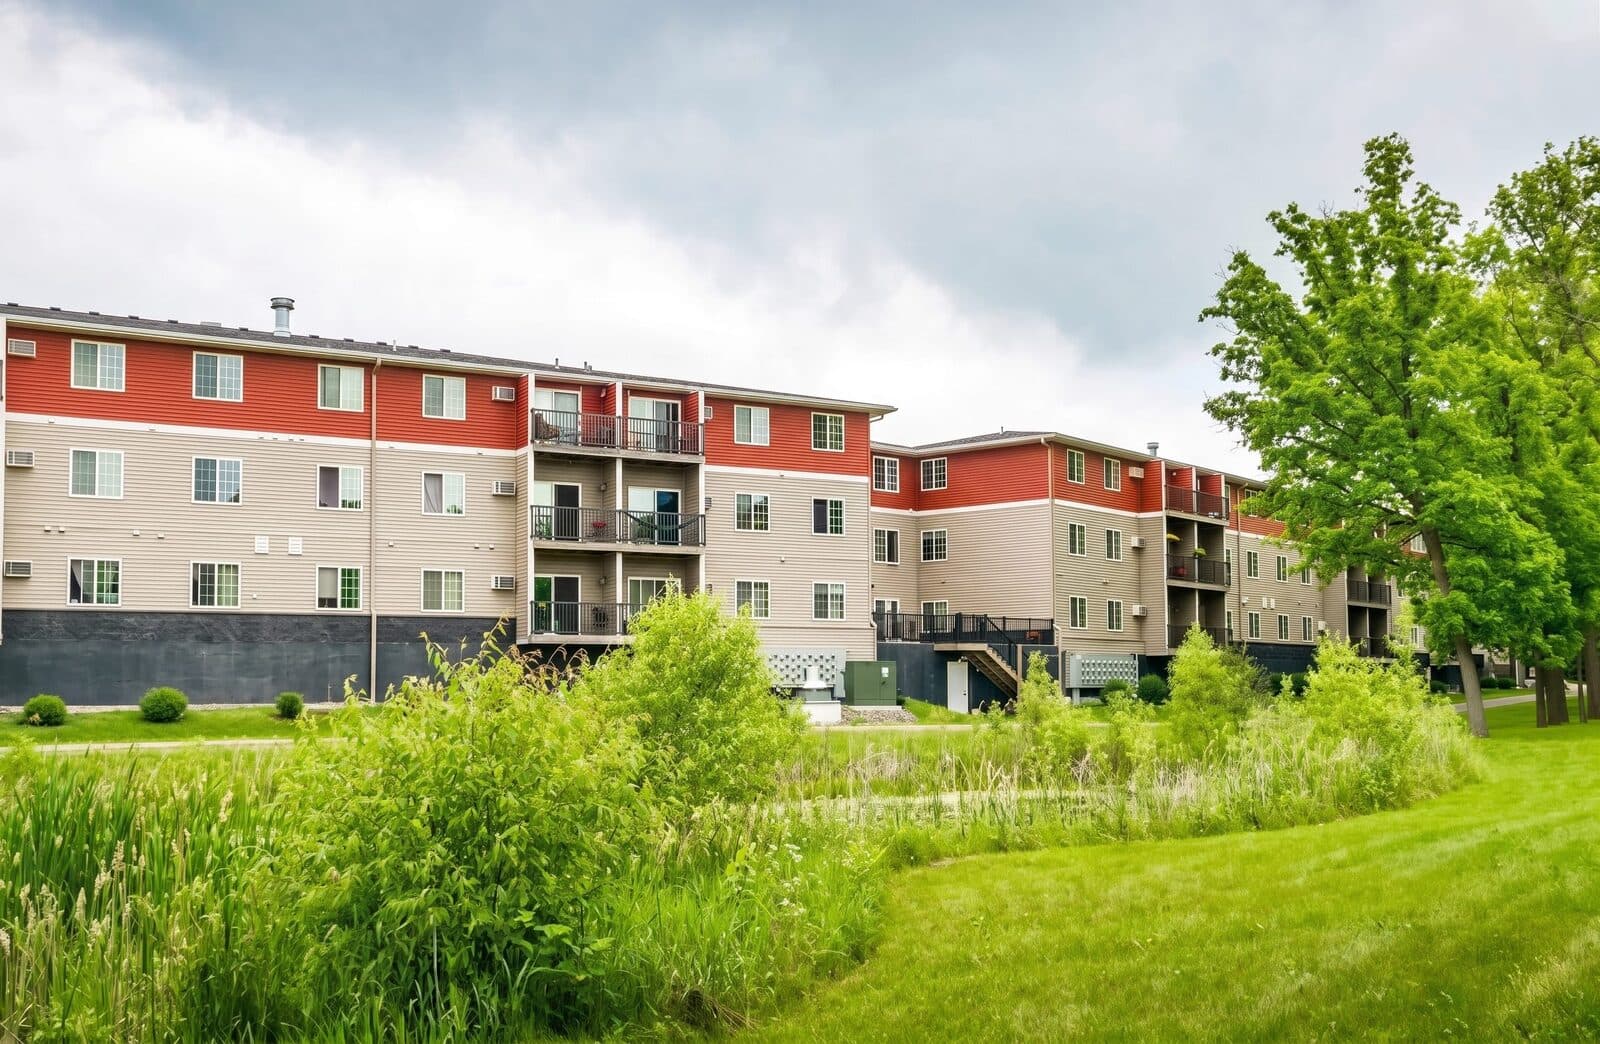
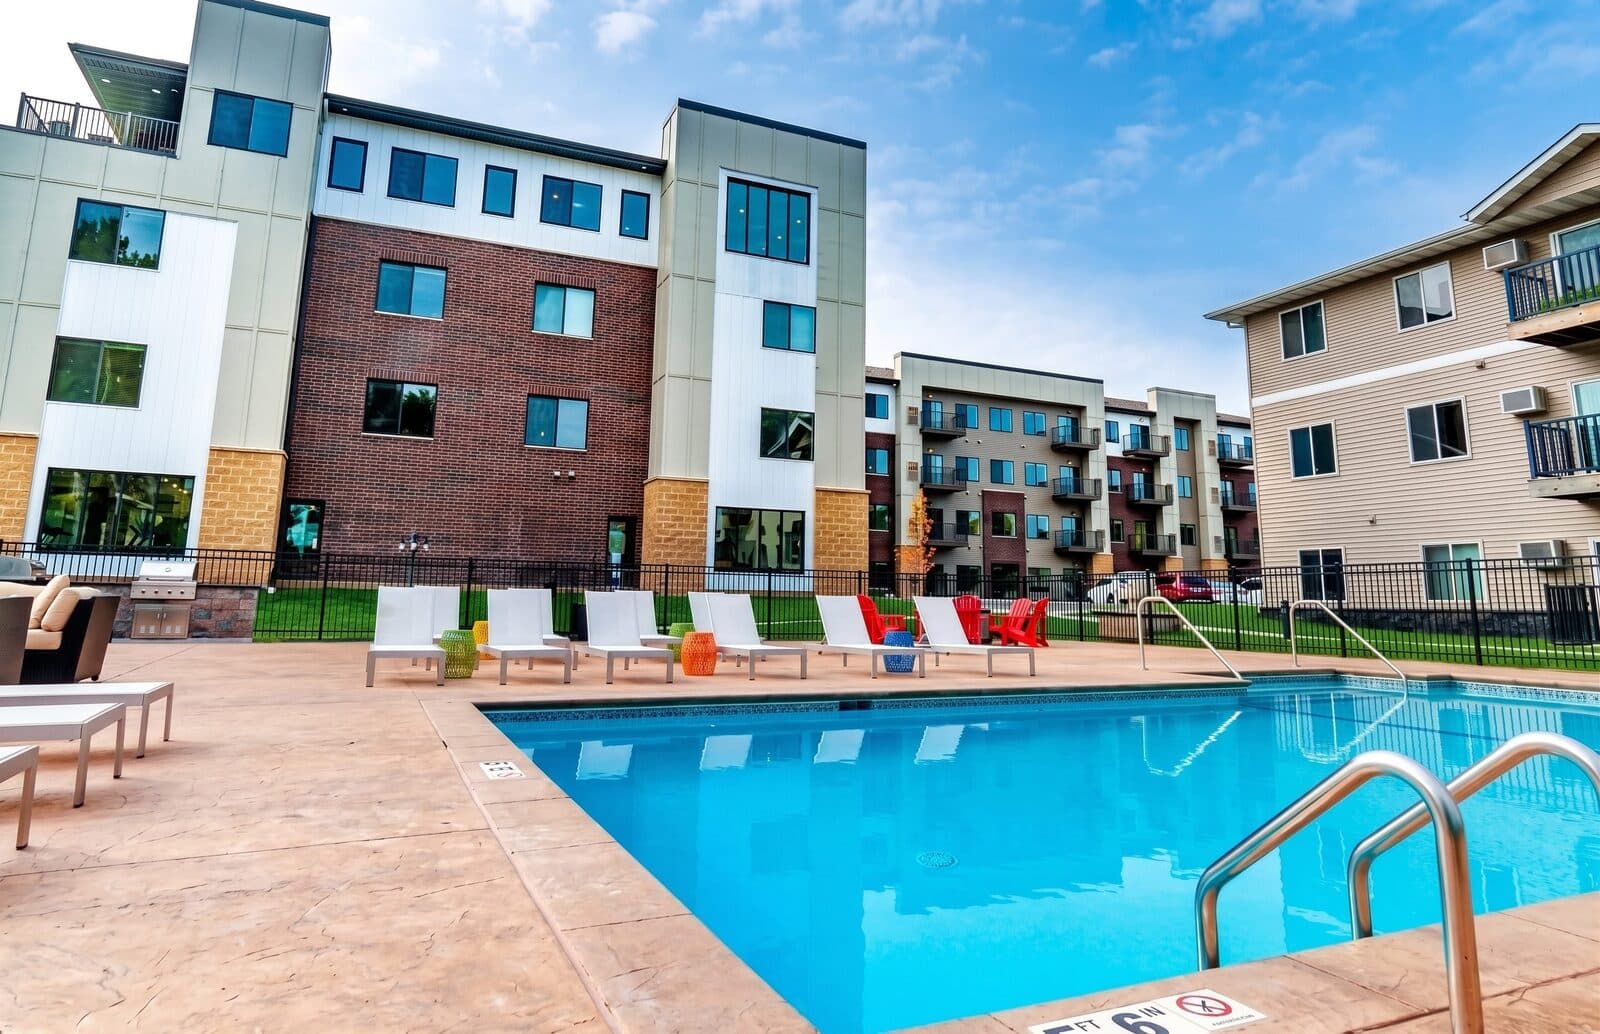
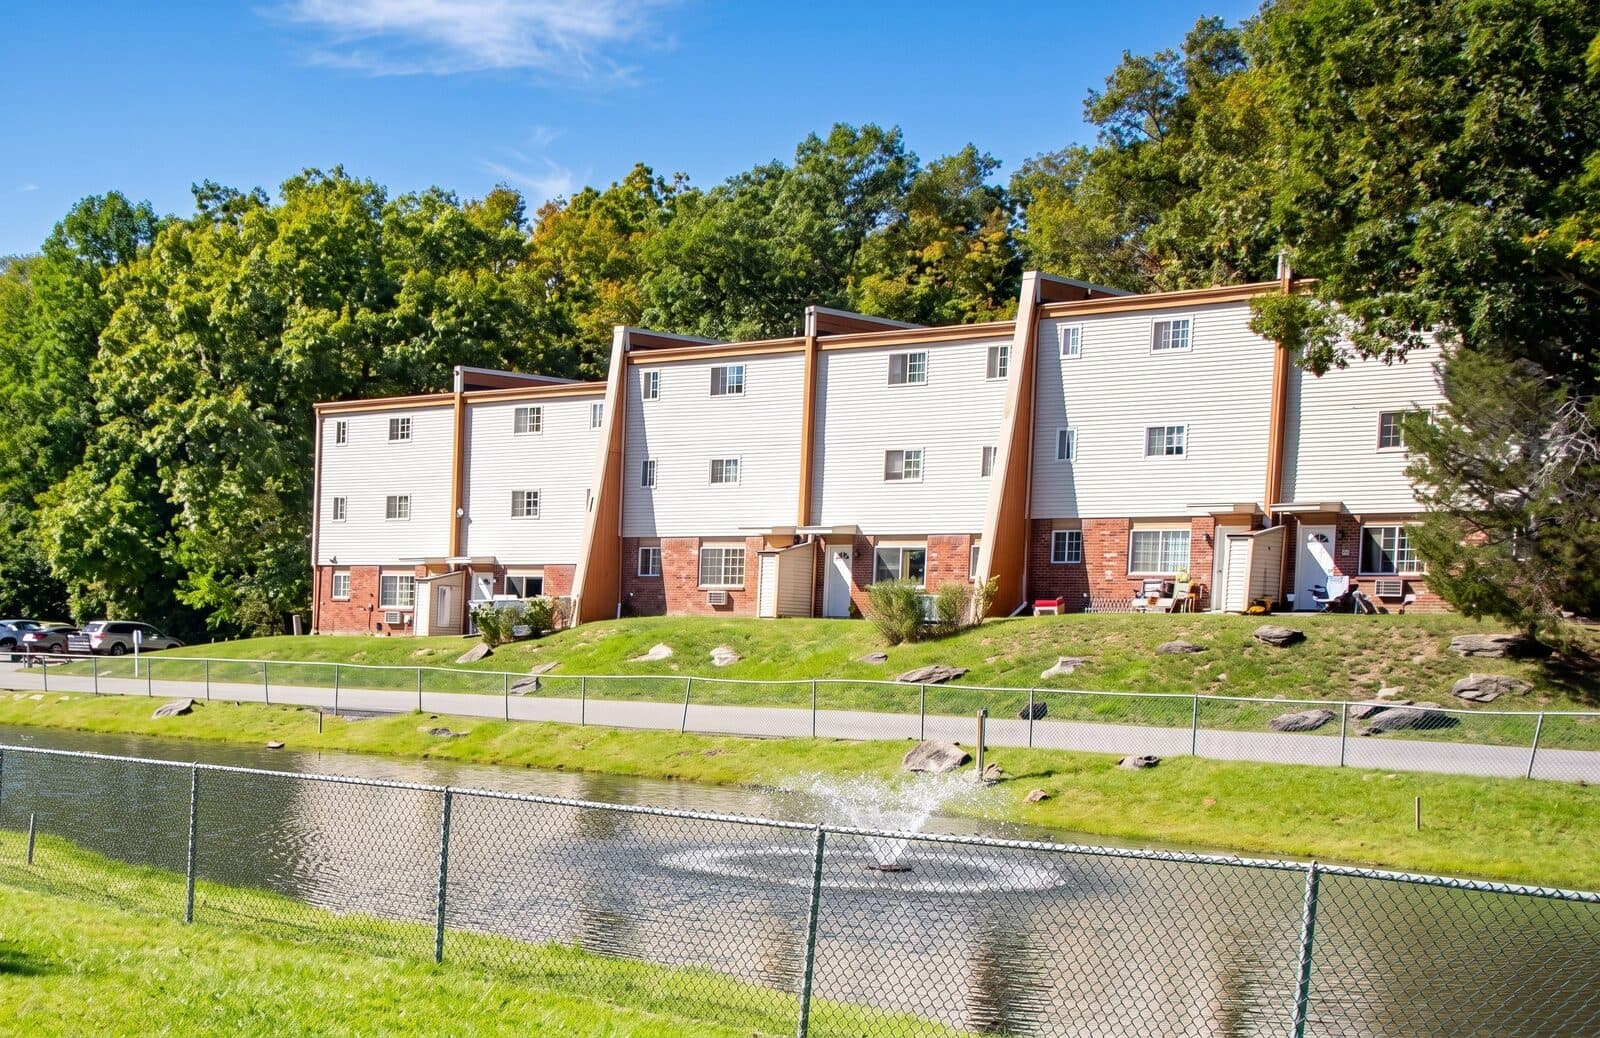
Nectar has been providing capital to commercial real estate sponsors since 2021 — 150+ transactions and $50M+ deployed across 29 states. Of those, 45 positions have gone full cycle since 2022: $15.3M advanced, $19.6M returned, across multifamily, single-family rental and hospitality assets. They were underwritten at 43 months on average and closed in 18; 34 of the 45 repaid ahead of their stated term. Fund II has paid 100% of the distributions owed to its investors. Five of those positions are below.
- Positions repaid in full
- 45
- Average realized term
- 18 months
- IRR on all full-cycle deals
- 18%
8 of 144 positions have been charged off: $2.8M advanced against $1.7M recovered, a net loss of 2.2% against all capital deployed. All of them are 2022 and 2023 vintages written as revenue assignment agreements — none in preferred equity, and none since June 2024. Fund II distributions were paid through them because Nectar absorbed the losses, not because they didn’t happen. Figures as of March 2026.
What gets measured
Three tiers, and only two of them are ours to claim.
Housing investment produces real economic activity beyond the housing itself. Nectar's share of that activity is not separable from the operator's, the contractor's or the local lender's, so it is reported as context rather than counted as an outcome Nectar produced.
Direct
Capital and operator effects
What Nectar deploys and what it changes about the business receiving it.
- Capital deployed, by operator, market and use of proceeds
- Portfolio growth and operating capacity
- Time to next project, and repeat transactions
- Outside capital unlocked per dollar of Nectar capital
Primary
Housing effects
The housing activity that follows, reported separately rather than as one unit count.
- Units created, acquired, preserved and improved — counted apart, not together
- Acquisitions and developments enabled
- Rehabilitation completed and maintenance invested
- Affordability profile of the units, before and after
Secondary
Community and economic effects
Real, and downstream of the housing investment rather than attributable to Nectar's capital alone. Reported as context, not as Nectar's result.
- Contractor and supplier spending
- Jobs supported across operators and their trades
- Local ownership retained and neighborhood asset quality
What we can and can't evidence yet
The measurement architecture is ahead of the measurements.
Nectar has five years of deployment and repayment data and no attribution study. The framework above describes what is being built, not what is already reported. Here is the line between them.
Reported today
- Capital deployed, by operator and market
- Housing units financed, firm-wide
- Repayment and loss performance across the full book since 2021
Not yet established
- Capital leverage — outside investment unlocked per dollar of Nectar capital
- Operator growth — portfolio growth and time to next project
- Housing investment enabled — incremental acquisition, development and rehabilitation
- Affordability — the unit affordability profile before and after investment
Where the capital actually goes.
The positions behind these figures — the operators, the assets, the terms and the payment history — sit behind the investor gate. Sign in with the email address we have on file, or agree to the NDA and go straight in.